
Profiling Code Using cProfile in Python
Profiling is a process that helps us understand the runtime behavior of a program, particularly efficiency in terms of time and space. In the broader programming and software development scope, profiling is crucial for optimizing code and improving its performance. In Python, one of the most commonly used profilers is cProfile. This built-in module can perform profiling and is widely used for its efficiency and ease of use.
Why Profile Your Code?
Profiling your code can help you identify bottlenecks and inefficiently written parts of your code. It provides a detailed breakdown of the time taken by different parts of your code, which can be instrumental in optimizing it. By profiling your code, you can ensure that your applications run as efficiently as possible, providing a better user experience and using resources better.
Profiling with cProfile
cProfile is a built-in Python module that can perform profiling. It provides a robust and flexible way to profile your Python applications. It's easy to use and provides detailed statistics about where your code spends its time.
How to use cProfile
Once you've decided to profile your code, you can use cProfile to gather data about its performance. Here's a simple example of how to use cProfile:
import cProfile
cProfile.run('your_function()', 'output.pstats')
This code will run your_function() and save profiling data to output.pstats.
Visualizing and Using Profiling Output
Once you've profiled your code, you can use the output to identify areas for improvement. The output cProfile includes information about how often each function was called, how long it took, and where it was called from.
You can visualize this data using a tool like gprof2dot and Graphviz. Here's an example of how to do this:
- First, you need to install
gprof2dotandGraphviz:
pip install gprof2dot2. Then, you can use cProfile to profile your code and output the results to a file:
import cProfile
cProfile.run('your_function()', 'output.pstats')
3. Next, you can use `gprof2dot` to convert the profiling results into a dot graph:
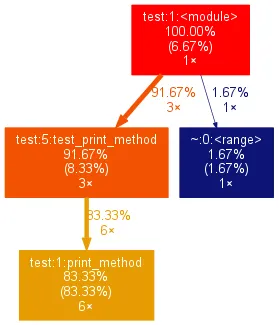
gprof2dot -f pstats output.pstats | dot -Tpng -o output.png4. Finally, you can open `output.png` to view the graph. This graph shows the call hierarchy of your code, with the time spent in each function represented by the node's size.
By examining this graph, you can identify which functions take the most time and focus your optimization efforts there.
Conclusion
Profiling is a powerful tool for understanding and optimizing your Python code. Using cProfile and tools like Graphviz, you can gain detailed insights into where your code spends its time, allowing you to identify and focus on areas needing optimization. Remember, efficient code is not just about making your programs run faster - it's also about providing a better user experience and making more efficient use of resources.
Happy profiling!
Further Reading
- Python's official documentation on the cProfile module
- Graphviz's official documentation
- 10 Tips to Maximize Your Python Code Performance in 2023
Want to learn how to integrate cProfile with Fast API?
You don't have full access to this post on Amitk.io at the moment.
Subscribe nowAlready have an account? Sign in